TalkPython – Python Data Visualization Course [FCO]
About
Have you ever been confused by all the different python plotting libraries? Have you tried to make a “simple” plot and gotten stuck and been unable to move forward? Do you want to make sophisticated, interactive data visualizations in python? If you answer yes, to any of these questions, then this course is for you.
Source code and course GitHub repository: github.com/talkpython/python-data-visualization
What’s this course about and how is it different?
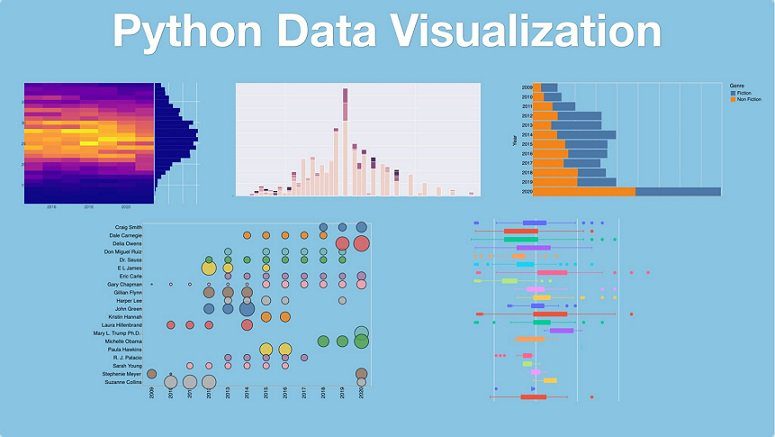
The python data visualization landscape has many different libraries. They are all powerful and useful but it can be confusing to determine what works best for you. This course is unique because you will learn about many of the most popular python visualization libraries. You will start by learning how to use each library to build simple visualizations. You will also explore more complex usage and identify the scenarios where each library shines.
By the end of this course, you will have a basic working knowledge of how to visualize data in python using multiple libraries. You will also learn which library is best for you and your coding style. Along the way, you’ll learn general visualization concepts to make your plots more effective.
In addition to the overview material, we will cover some of the more complex, interactive visualization dashboard technologies.
What topics are covered
In this course, you will:
– Review the python visualization landscape
– Explore core visualization concepts
– Use matplotlib to build and customize visualizations
– Build and customize simple plots with pandas
– Learn about seaborn and use it for statistical visualizations
– Create visualizations using Altair
– Generate interactive plots using the Plotly library
– Design interactive dashboards using Streamlit
– Construct highly custom and flexible dashboards using Plotly’s Dash framework
Who is this course for?
Developers and Data Analysts that have some experience with python but have not developed a competency in a python visualization library. This course is also helpful for those that feel restricted by their current plotting tools and wish to explore other options.
Note: All software used during this course, including editors, Python language, etc., are 100% free and open source. You won’t have to buy anything to take the course.
Instructor(s)
Hi, I’m Chris Moffitt. I am passionate about finding ways to use the power of Python to be more efficient and effective in a business setting. I’ve been using Python for over 15 years to solve a variety of real-world problems for everything from web development to system administration and most recently data science.
General Info:
Author(s): Chris Moffitt
Language: English
Updated: 2023
Videos Duration: 4.6h
Course Source: https://training.talkpython.fm/courses/python-data-visualization


Size: 776MB